Multivariate
Reduces the samples-by-features matrix to two dimensions so you can see which samples resemble each other.
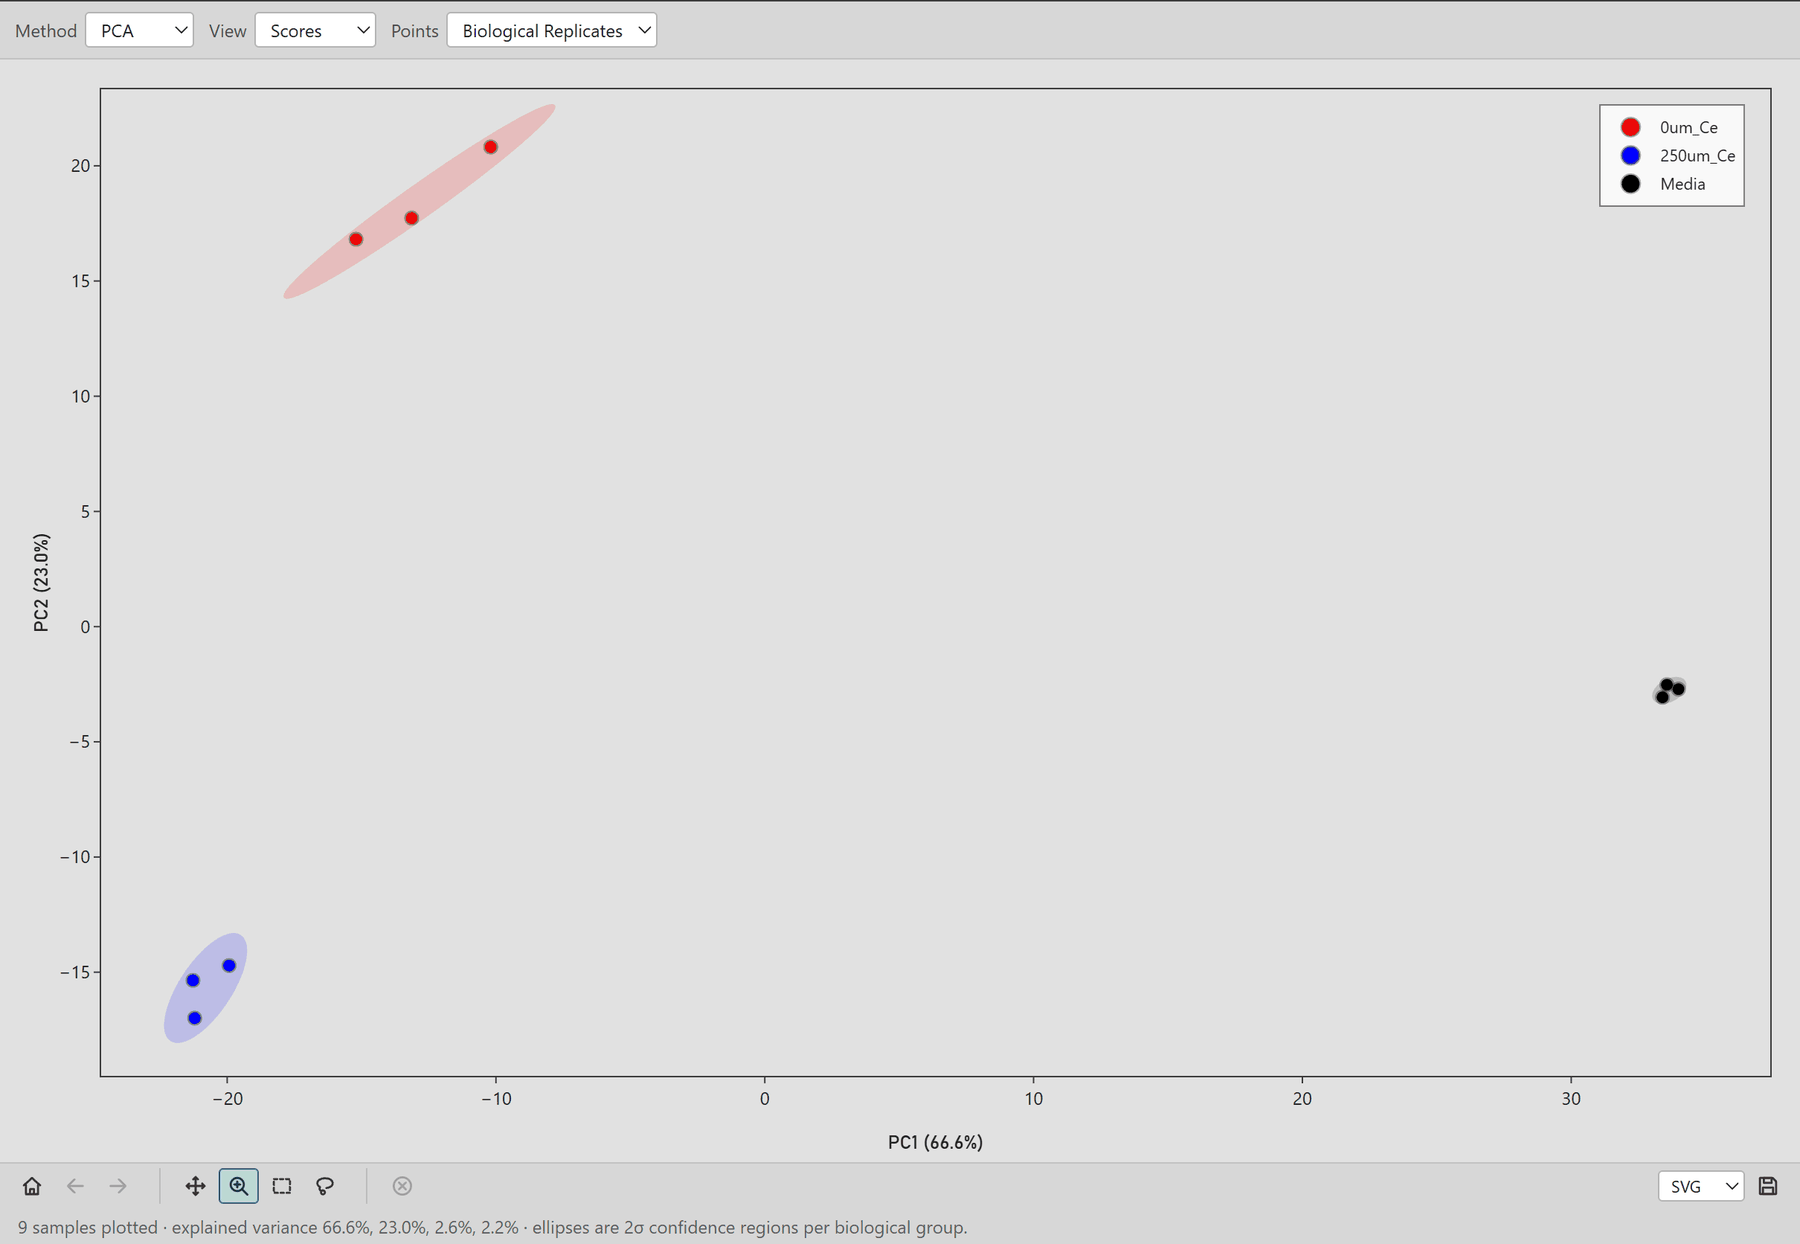
Controls
Method
- NMDS (default): non-metric multidimensional scaling on Bray-Curtis dissimilarity, using raw abundances. It is rank-based, so the axes have no percentage; the title reports the stress instead.
- PCA: principal component analysis on mean-centred, unit-variance-scaled features. Axis labels give the percentage of variance each component explains.
- PLS-DA: partial least squares discriminant analysis, supervised by biological group. Use it when PCA shows overlapping groups but you expect a real difference and want the direction that separates them best.
View
- Scores (default): one point per sample, coloured by group, with an ellipse marking each group's 2σ confidence region.
- Loadings: the 25 features that contribute most to the two displayed components, as arrows from the origin. A feature selected elsewhere is marked here too.
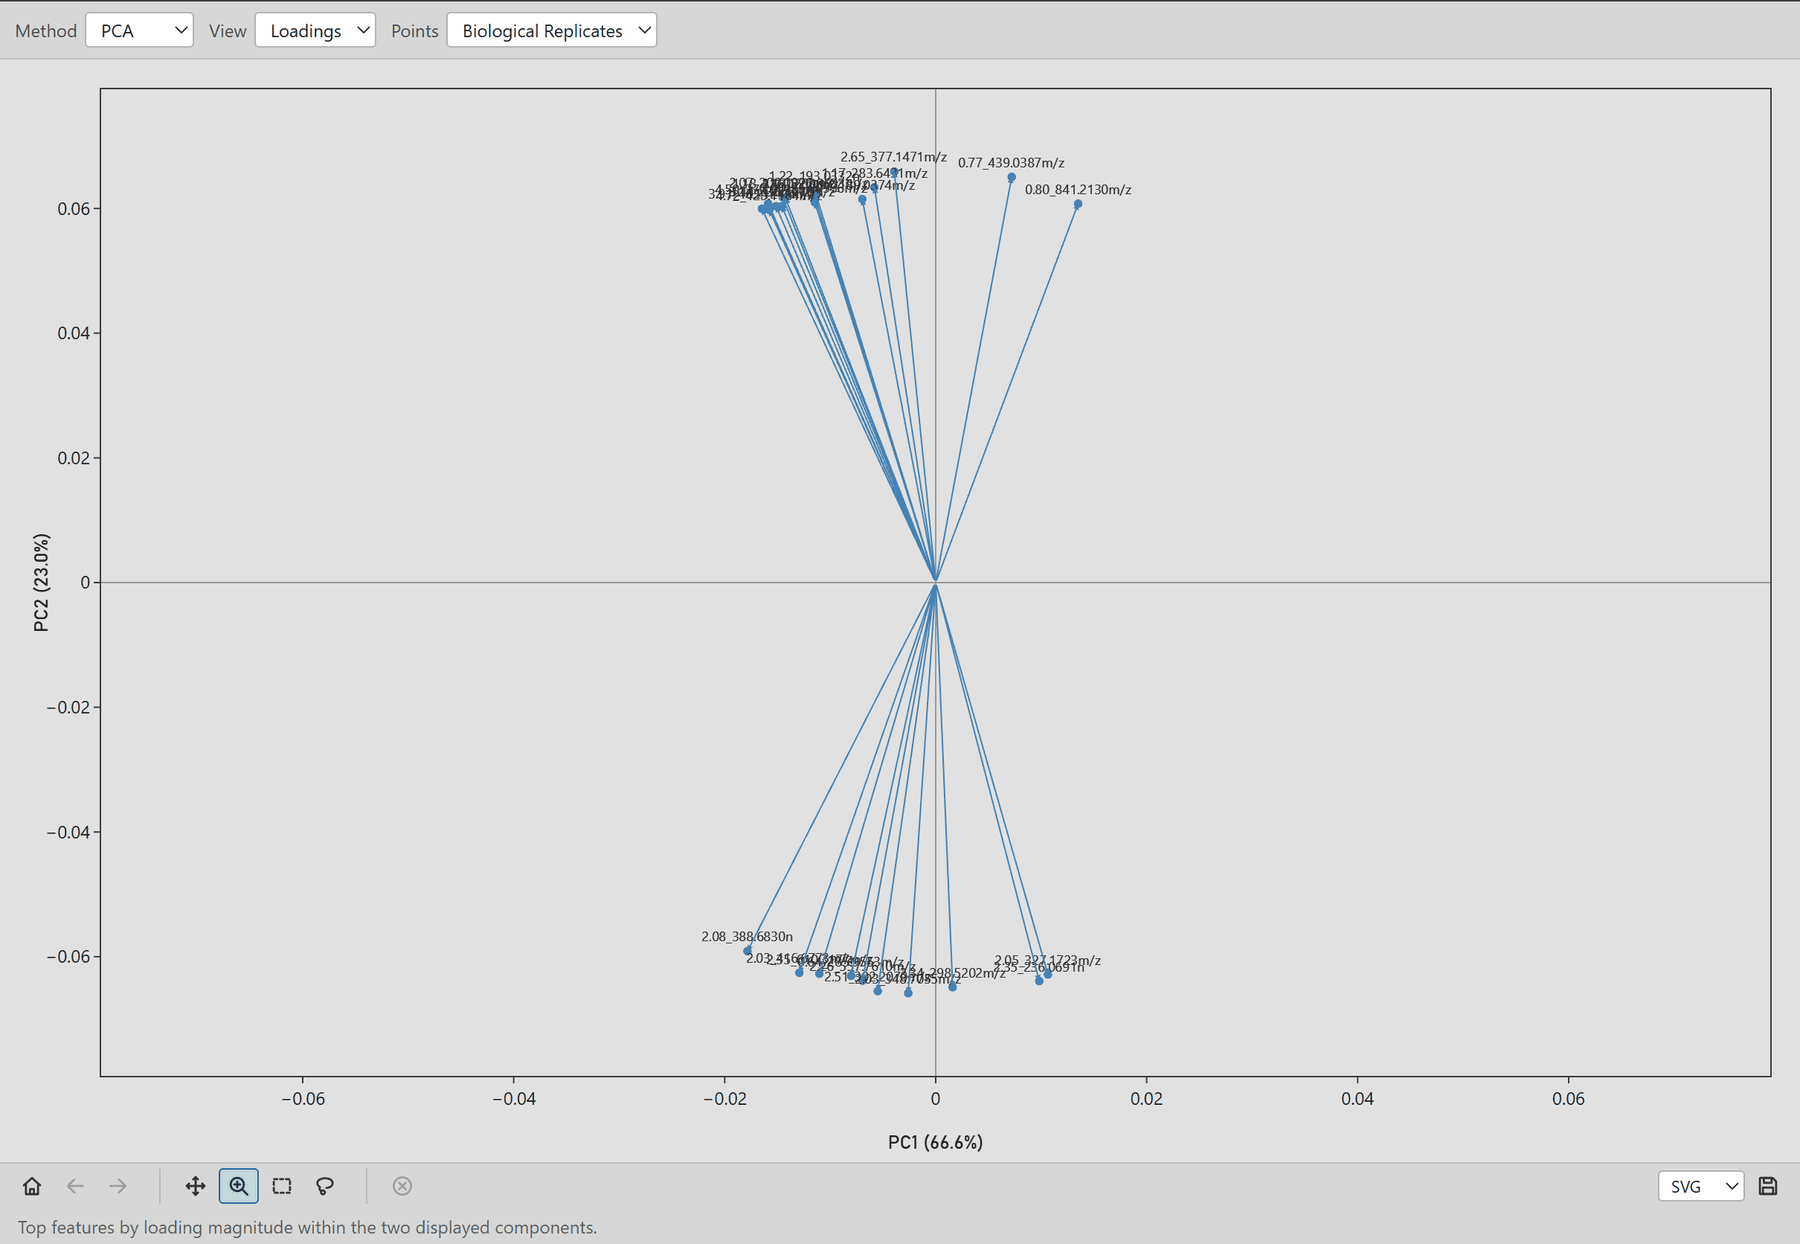
- Biological Replicates (default): technical replicates are averaged, one point per sample.
- Individual Injections: one point per injection, useful for spotting a single bad injection.
Clicking a score point selects that injection, which is then shown in the status bar.