Volcano
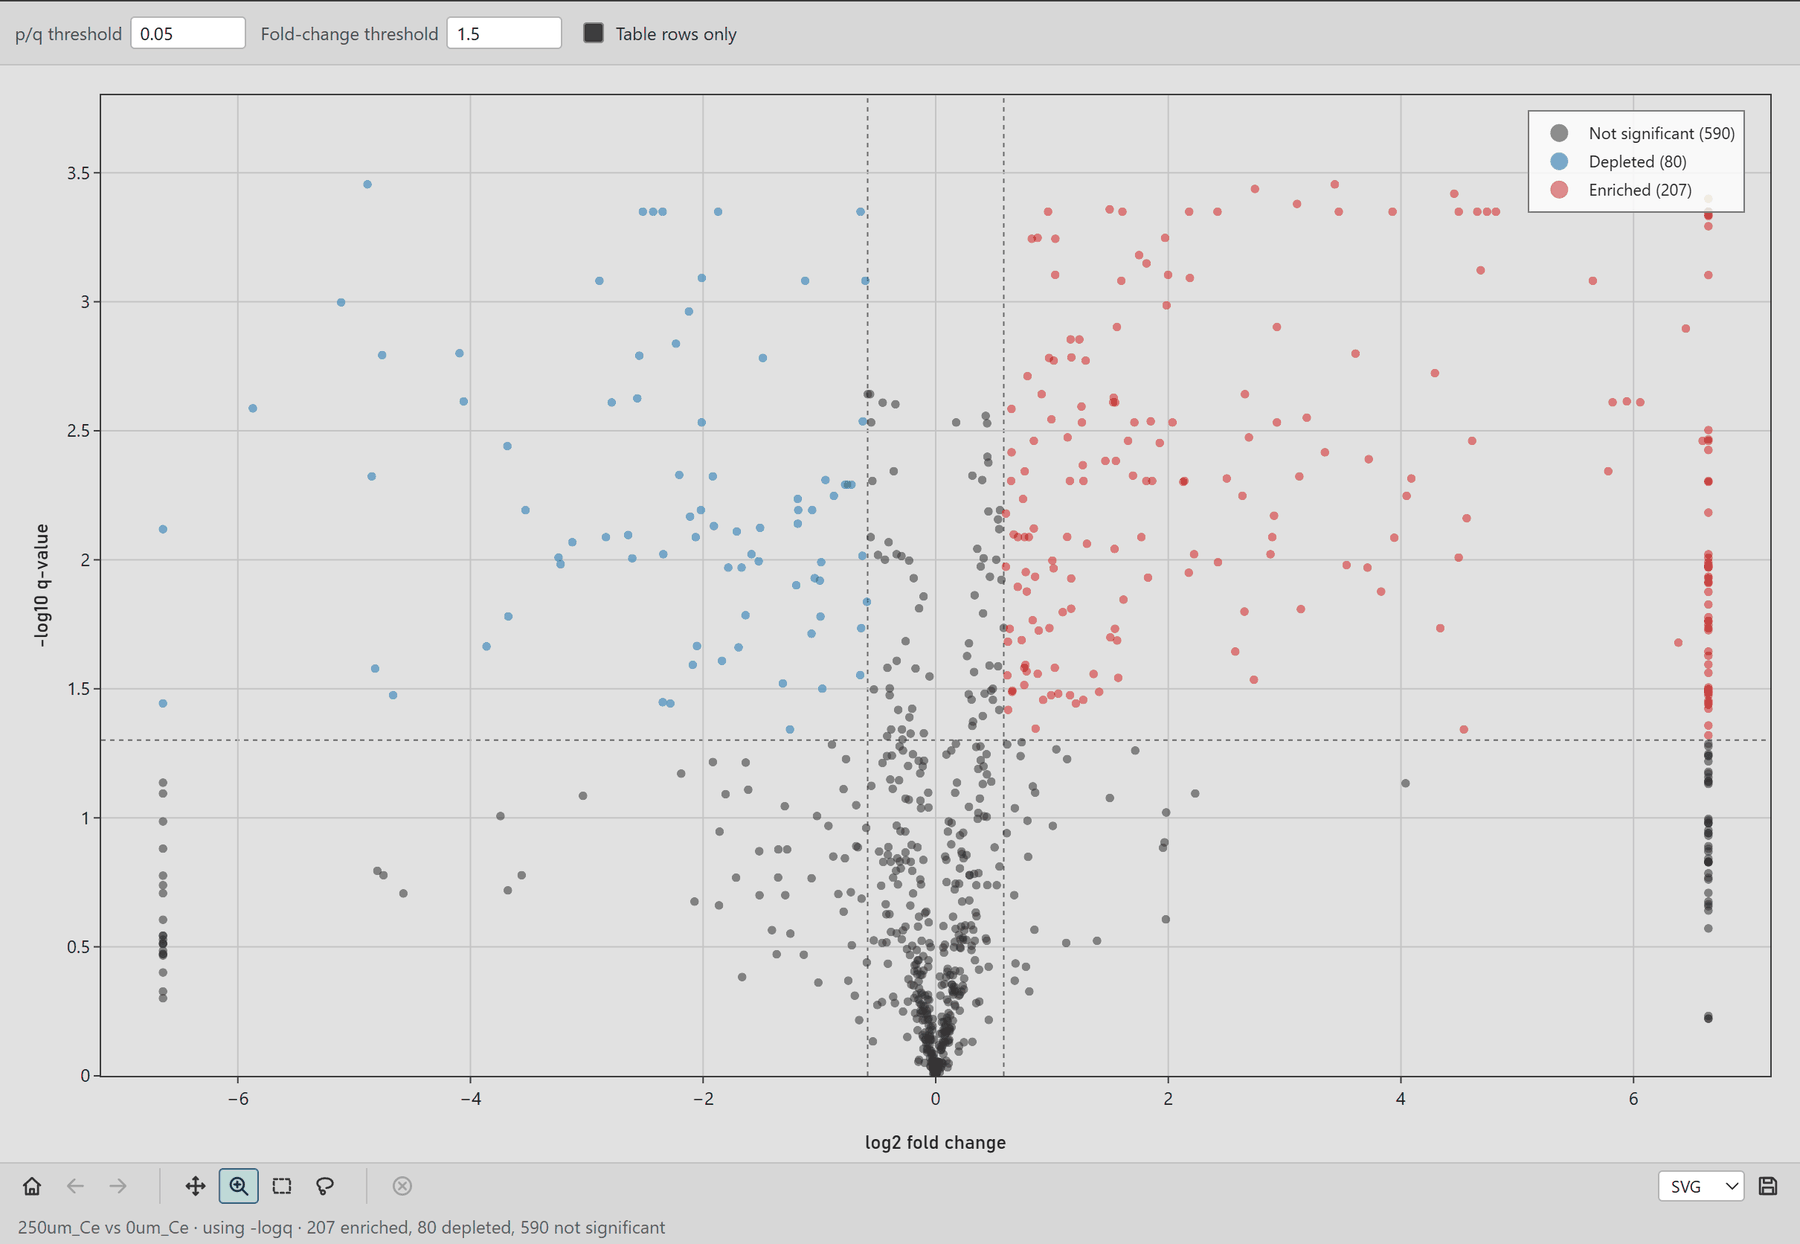
log2 fold change (x) against −log10 of the FDR-corrected q value (y) for the two groups chosen in Analysis Settings. Features significantly higher in the experimental group are Enriched (red), significantly lower ones are Depleted (blue), and the rest are grey.
Controls
| Control | Default | Meaning |
|---|---|---|
| p/q threshold | 0.05 | Significance cut-off, drawn as the horizontal dashed line |
| Fold-change threshold | 1.5 | Minimum fold change either way, drawn as the two vertical dashed lines (±log2 1.5) |
| Table rows only | off | Plot only the features listed in Feature Info |
The line under the plot names the comparison and counts the features in each class.
Features detected in only one of the two groups have no finite fold change. They are given a fold change of 100 (or 0.01) and line up in columns at the left and right edges.
How the statistics are computed
Fold change is the ratio of the two groups' average abundances. The t-test uses an uncertainty that combines the technical variation (between injections of one sample) and the biological variation (between samples of one group), added in quadrature, with effective degrees of freedom from the Welch-Satterthwaite equation. If a dataset has only technical or only biological replicates, the available variation is used on its own. q values are Benjamini-Hochberg corrected across the plotted features.
The per-group statistics for every feature are in _summarydata.csv on the
Downloads tab.