m/z vs RT
Every filtered feature at its m/z (y) and retention time (x), coloured by Plot Feature Set. Opacity follows log abundance, so abundant features are drawn more solidly.
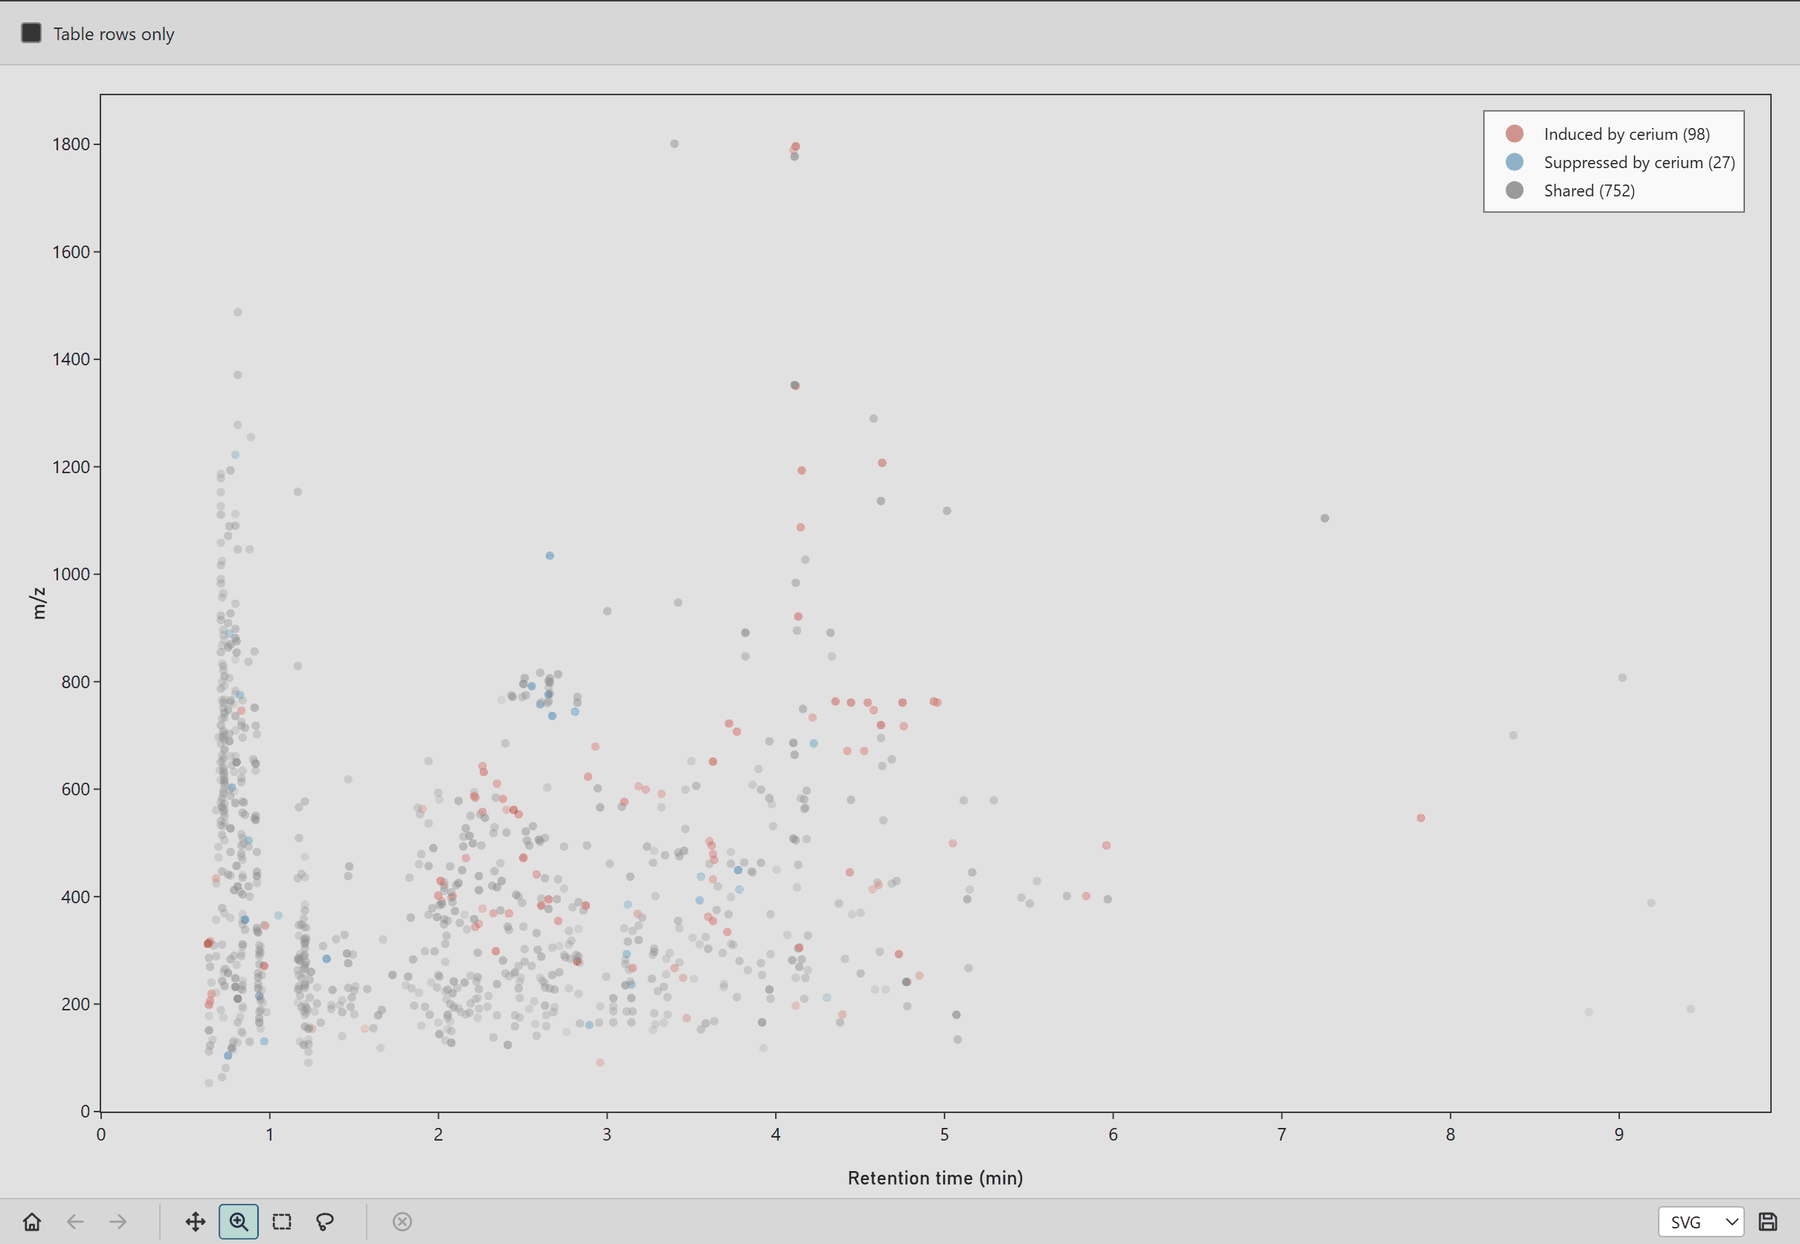
Retention time is a rough proxy for polarity, so the plot shows whether the features unique to one condition share a mass range or polarity.
Table rows only limits the plot to the features listed in Feature Info. See Working with results.